Data visualisation plays a critical role in today’s fast-paced and data-driven environment. With the increasing volume and complexity of data, it has become essential to present information in a visually appealing and easy-to-understand manner.
At VE3, we specialise in implementing data visualisation solutions that help businesses unlock valuable insights from their data.
Using data visualisation tools, visual analytics, and advanced graphing techniques, we empower organisations to make more effective data-driven decisions.
Our expertise extends to creating data-driven visualisations that enable clients to explore and analyse complex data sets easily. We also provide customisable design and branding options, robust collaboration and sharing features, and seamless integration with existing workflows.
Our solutions prioritise mobile device accessibility, embedded data visualisation, and secure data access, delivering scalable and performance-optimised outcomes for our clients.
By leveraging the power of data visualisation, we enable businesses to gain actionable insights and drive better business outcomes.
We offer end-to-end data visualisation services designed to support modern enterprise analytics needs.
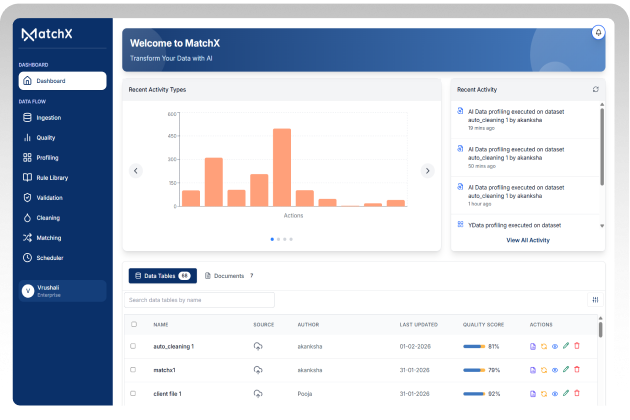
We design intuitive dashboards that present key metrics through interactive charts, filters, and drill-downs. These dashboards provide real-time visibility and enable users to explore data at multiple levels of detail.

Our visualization solutions focus on clarity and context. We create story-driven visuals that simplify complex data and help stakeholders understand the “why” behind the numbers.

We enable self-service visualization capabilities that allow business users to create, customize, and share dashboards independently reducing dependency on IT and accelerating insights.

We embed visual insights directly into enterprise applications, portals, and workflows so users can access analytics at the point of decision, improving adoption and impact.

We build real-time visualization solutions that support operational monitoring and rapid response. This enables teams to track live performance, detect issues early, and act immediately.

We enhance visualizations with AI-driven capabilities suchas automated insights, trend detection, and predictive indicators helping organizations move from descriptive to forward-looking analytics.

Our visualizations are designed for accessibility across devices, ensuring insights are available on desktops, tablets, and mobile devices for distributed and remote teams.

We establish visualization best practices and governance frameworks to ensure consistency, accuracy, security, and trust across dashboards and reports.


Our data visualization approach is structured, scalable, and focused on business outcomes:

Identify business goals, users, and data sources

Create intuitive, scalable visualization frameworks

Build interactive dashboards and visual analytics

Embed insights into BI platforms and workflows

Continuously improve usability, performance, and value
Here at VE3, we provide end-to-end data visualisation services to make complex data easily digestible. Our process includes understanding your data requirements, selecting the most suitable visualisation tools and techniques, designing custom visuals tailored to your business needs, and integrating these insights into your existing workflows. We ensure that the created visualisations are not only visually appealing but also convey meaningful insights, empowering your organisation to make informed decisions, streamline processes, and drive growth effectively and efficiently.
VE3 integrates artificial intelligence (AI) and machine learning technologies into data visualisation solutions, helping businesses analyse complex sales data to identify trends, monitor performance against targets, and uncover areas for improvement. This advanced approach enables sales teams to make data-driven decisions and optimise their strategies with greater precision.
VE3 assists healthcare organisations in visualising patient data by incorporating advanced analytics and machine learning algorithms to identify trends, optimise treatment plans, and improve patient outcomes. This personalised approach to healthcare analytics helps providers make more informed decisions, enhance patient care, and reduce costs.
VE3 assists organisations in visualising customer data to identify distinct segments and preferences and predict future behaviours and trends using advanced analytics. This enables businesses to tailor marketing efforts more effectively, enhancing customer satisfaction and increasing revenue.
VE3 provides real-time financial data visualisation solutions that help organisations monitor financial performance, track key metrics, and generate insights for informed decision-making. These advanced tools enable businesses to identify growth opportunities, manage risk, and optimise financial performance with greater agility.
VE3 helps businesses visualise market data to identify trends, assess the competitive landscape, and uncover growth opportunities. Incorporating sentiment analysis and predictive modelling enables organisations to make informed strategic decisions and maintain a competitive edge in the ever-changing market landscape.
VE3 incorporates natural language processing (NLP) techniques into data visualisation solutions that analyse social media data, allowing businesses to understand customer sentiment, monitor brand reputation, and identify influencers more effectively. These insights enable organisations to optimise their social media strategies and engage with their target audience more efficiently.
VE3 leverages advanced analytics, machine learning, and data visualisation techniques to help organisations identify and prevent fraud through real-time anomaly detection. This advanced approach enables businesses to mitigate risks, improve security, and effectively ensure regulatory compliance.
VE3 helps retailers visualise sales, inventory, and customer data across various channels and touchpoints, optimising store operations, improving product assortment, and enhancing customer experience. This comprehensive, data-driven approach drives growth and profitability in the increasingly competitive retail landscape.
Organizations choose VE3 for data visualization because we combine analytics expertise with strong design and business understanding.

.png)


Our Business Intelligence services support complex, data-intensive environments across industries, including:
Stay current with the strategies, trends, and technologies defining the next era of digital excellence

.jpg)


Effective data visualization transforms complexity into clarity. VE3 helps you empower teams with intuitive visual insights that support faster, smarter decisions.
Connect with our experts to modernize your data visualization capabilities and unlock greater business value from your data.
.png)


%20(1).jpg)
.jpg)
.png)